Class 7: Markup Pricing and Elasticity
Textbook reading: Kreps, Chapter 7, Sections 7.1 through 7.3 (pages 155 to 166). Kreps writes elasticity as ν; we write \(\varepsilon\). Where he computes an elasticity with a derivative, use his five-step recipe on pages 156 to 157 instead; it needs only a calculator. Skip the subsections “Elasticity Using Calculus” and “The Price Elasticity of Inverse Demand” (pages 157 to 159). His derivation of MR = P(1 + 1/ν) on page 161 uses calculus; in class we get the same formula from a picture. Don’t skip the “Warning!” subsection on pages 165 to 166. Section 7.4 is next class’s reading.
Key Ideas
From MR = MC to markup
- Class 6: price where marginal revenue equals marginal cost
- Businesses ask the same question as a markup: how far above cost should the price be?
- The answer depends on one number: how customers react to a price change
Revenue as a rectangle
- Total revenue is price times quantity: the rectangle under the demand curve at the chosen point
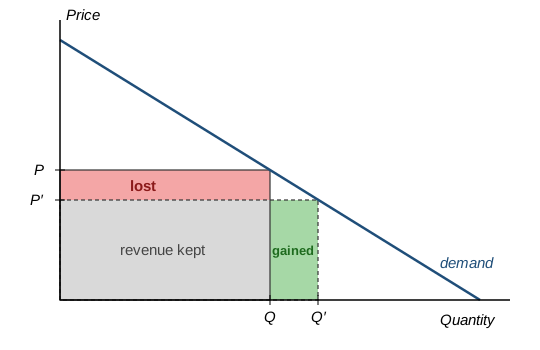
- A small price cut changes the rectangle in two places: a strip gained along the right edge (new units, sold at roughly the old price) and a strip lost along the top (the price cut on every unit that was already selling)
- Marginal revenue is the net change in the rectangle per new unit. Q19 measures the two strips; Q20 writes them in terms of elasticity and turns the picture into the markup rule
Elasticity of demand
- (Own-price) elasticity \(\varepsilon\): the percentage change in quantity sold per 1% change in price
- Recipe: start at the current price, raise it by 1%, find the percentage fall in quantity, take the ratio
- Negative for any downward-sloping demand; this course keeps the minus sign
- \(\varepsilon\) = −0.25: a 1% price rise cuts sales by a quarter of a percent
- \(\varepsilon\) = −4: a 1% price rise cuts sales by 4%
- Percentages, not slopes: a slope depends on units (gallons or liters, dollars or cents); a percentage does not
Problems of the Day
Q19: Two Rectangles
A firm faces the demand function q = 10,000 × (50 − p).
If the firm sets p = 10, what quantity does it sell, and what is its total revenue?
Sketch the demand line with p on the vertical axis and q on the horizontal axis, mark p = 10, and draw the rectangle whose area is total revenue. Now the firm cuts its price by 1%, to $9.90. Shade the strip gained on the right (the new units) and the strip lost along the top (the price cut on every unit that was already selling). Compute the area of each, and the net change in total revenue. Divide the net change by the number of new units: that is the marginal revenue of a unit at this point. Should the firm ever cut its price from $10 to $9.90?
Q20: Naming the Ratio
- Elasticity of demand is defined as the percent change in quantity demanded divided by the percent change in price: \(\varepsilon = \frac{\% \Delta Q}{\% \Delta P}\), where “percent change” is \(\frac{\text{new} - \text{old}}{\text{old}}\). Compute the elasticity of the Q19 demand line at \(p = 10\), using the table below.
| price | quantity demanded |
|---|---|
| 10 | 400K |
| 9.90 | 401K |
Repeat Q19(b) at a general point: price P, quantity Q, elasticity \(\varepsilon\), and a 1% price cut.
- Step 1: Show that the area of the lost strip is \(0.01 P Q\).
- Step 2: Show that the area of the gained strip is \(-0.01 \varepsilon Q (.99 P)\).
- For simplicity, we’ll forget about the 0.99 and let the area of the gained strip be \(-0.01 \varepsilon Q P\).
Change in total revenue to marginal revenue. Areas gained minus lost is the change in total revenue. To calculate the marginal revenue, we need to divide the change in total revenue by the number of extra units sold, which you already showed is \(-0.01 \varepsilon Q\).
- Step 1: Take \(\text{MR} = \frac{\text{gained} - \text{lost}}{-0.01 \varepsilon Q}\) and show this simplifies to \(\text{MR} = P + \frac{P}{\varepsilon}\).
- Step 2: Combine into a single fraction and show \(\text{MR} = P(1 + \frac{1}{\varepsilon})\).
- Step 3: Write down the markup rule. At the profit-maximizing price, we know that all we have to do is to set marginal cost equal to marginal revenue. If marginal cost is $25 and \(\varepsilon = -2\), what is the profit-maximizing price?
Q21: Run it Back
Now run Q20 backward. A supermarket sells groceries at about 25% over what it pays; a fashion retailer at about 100%; a patented drug at about 900%. What elasticity is each of them facing, if they are pricing well? Interpret each elasticity: what does it imply about the consumer response to a 1% price change?
Answers
- Q19:
- q = 10,000 × 40 = 400,000 units. Total revenue = 10 × 400,000 = $4,000,000.
- At $9.90, q = 10,000 × 40.1 = 401,000, so 1,000 new units. Gained strip: 1,000 × $9.90 = $9,900. Lost strip: 400,000 × $0.10 = $40,000. Net change in revenue: −$30,100. Marginal revenue: −30,100 / 1,000 = −$30.10 per unit. Never: the cut lowers revenue and raises cost, so it lowers profit twice over. A firm at this point should be raising its price.
- Q20:
- At $10: +0.25% / −1% = −0.25.
- Step 1: the Q units already selling each lose 0.01P, so the lost strip is \(Q \times 0.01P = 0.01PQ\). Step 2: a 1% cut raises quantity by \(-\varepsilon\) percent (positive, since \(\varepsilon < 0\)), so there are \(-0.01\varepsilon Q\) new units, each sold at the new price \(0.99P\); the gained strip is \(-0.01\varepsilon Q(0.99P)\), or about \(-0.01\varepsilon QP\).
- Step 1: \(\text{MR} = \dfrac{-0.01\varepsilon QP - 0.01PQ}{-0.01\varepsilon Q}\). Split the fraction: the first term is \(\dfrac{-0.01\varepsilon QP}{-0.01\varepsilon Q} = P\) and the second is \(\dfrac{-0.01PQ}{-0.01\varepsilon Q} = \dfrac{P}{\varepsilon}\), so \(\text{MR} = P + \dfrac{P}{\varepsilon}\). Step 2: factor out P: \(\text{MR} = P\left(1 + \dfrac{1}{\varepsilon}\right)\). Check at $10: 10 × (1 + 1/(−0.25)) = 10 × (1 − 4) = −$30, against −$30.10 in Q19(b); the gap is the 0.99 dropped in (b). Step 3: setting \(P(1 + 1/\varepsilon) = \text{MC}\) gives \(P = \dfrac{\text{MC}}{1 + 1/\varepsilon} = \text{MC} \times \dfrac{\varepsilon}{\varepsilon + 1}\), and the percentage markup is \(\dfrac{P - \text{MC}}{\text{MC}} \times 100 = \dfrac{-100}{1 + \varepsilon}\). With MC = $25 and \(\varepsilon = -2\): \(P = 25 / (1 - 0.5) = \$50\), a 100% markup.
- Q21: Markup m (as a fraction) = \(-1/(1 + \varepsilon)\) gives \(\varepsilon = -(1 + 1/m)\). Supermarket (25%): \(\varepsilon = -5\), a 1% price rise loses 5% of sales; shoppers have another store down the road. Fashion retailer (100%): \(\varepsilon = -2\), a 1% rise loses 2%. Patented drug (900%): \(\varepsilon = -1.11\), a 1% rise loses about 1.1% of sales; patients have almost nowhere else to go. With \(\varepsilon\) so close to −1, the denominator \(1 + \varepsilon\) in the markup formula is tiny, so the markup is enormous; no profit-maximizer prices where \(\varepsilon\) is between −1 and 0, since there a price cut lowers revenue and raises cost.